|
||
 Enlarge
|
Licensing | |
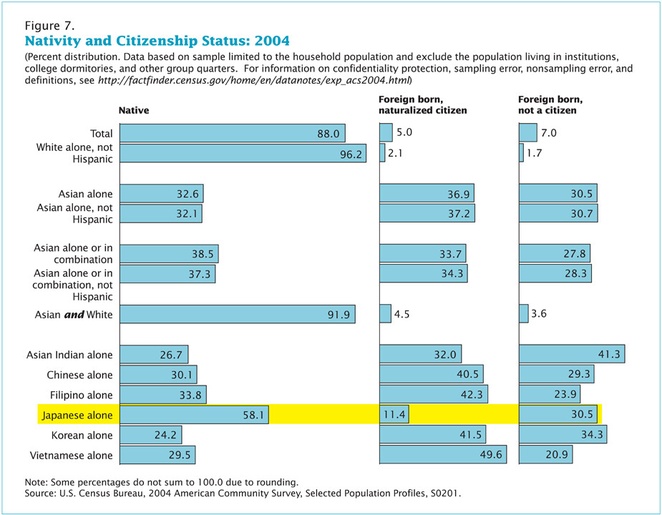
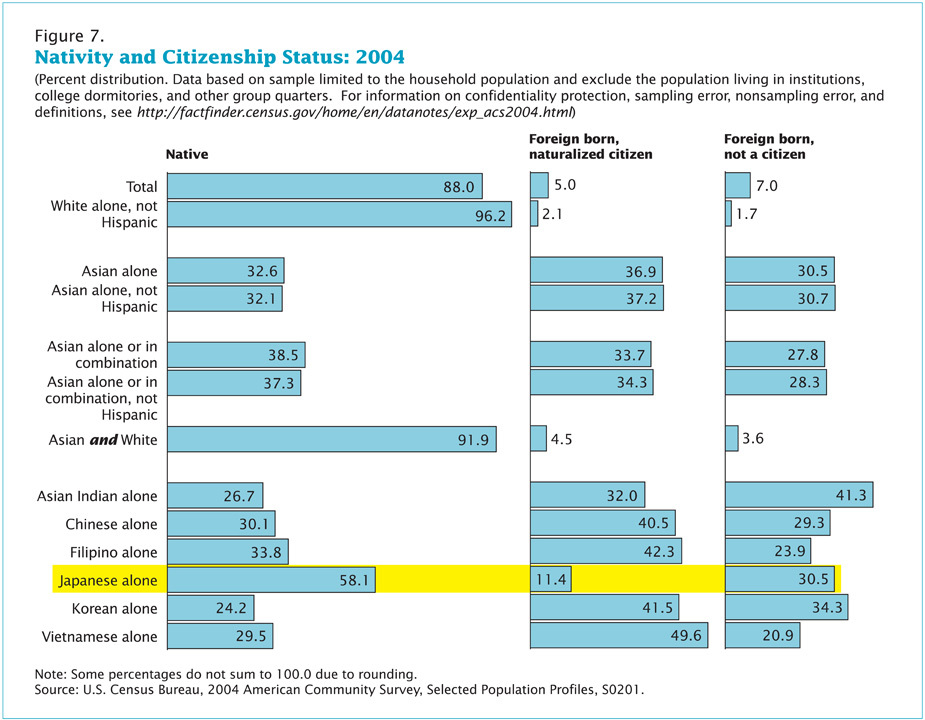
This table was extracted from The American Community - Asians: 2004 (Asian Community Survey Reports), issued on February 2007.
The entire report presents a portrait of the Asian population in the United States. It is part of the American Community Survey (ACS) report series. Information on demographic, social, economic, and housing characteristics in the tables and figures are based on data from the 2004 ACS Selected Population Profiles and Detailed Tables. The data for the Asian population are based on responses to the 2004 ACS question on race, which asked all respondents to report one or more races.
According to the report, more than two-thirds of Asians were U.S. citizens, either through birth (about 33 percent) or naturalization (about 37 percent). Among non-Hispanic Whites, about 96 percent were native, about 2 percent were U.S. citizens through naturalization, and the remaining 2 percent were born abroad and not U.S. citizens.
Among the specific Asian groups, Japanese had the highest proportion of natives (about 58 percent) and Koreans had the lowest (about 24 percent).
To see the entire report, The American Community - Asians: 2004 (Asian Community Survey Reports)
http://www.census.gov/prod/2007pubs/acs-05.pdf
This work is licensed under a Public Domain
 vkm
—
Atualizado em Mar 30 2011 7:59 p.m.
vkm
—
Atualizado em Mar 30 2011 7:59 p.m.
 Oshogatsu 2021
 My Collection of Daruma
 Seattle Japanese Garden
 Mitsuwa Natsu Matsuri 2007
 Kubota Garden
 Exploring My Family "Garden"
 My early J-Town memories
 My Hinamatsuri
 My Oshogatsu 2007
 National Cherry Blossom Festival 2005
 Journal feed